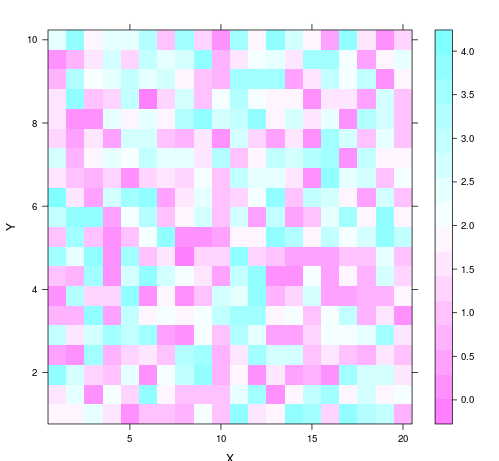
basic use of levelplot()
we use lattice package that allow to build heatmaps so we can use levelplot() function here.
we take input is a data frame with three columns that is X and Y coordinte and its value.
library("lattice")

x <- seq(1,20, length.out=20)
y <- seq(1,10, length.out=20)
data <- expand.grid(X=x, Y=y)
data$A <- runif(400, 0, 4)

levelplot(A ~ X*Y, data=data  ,xlab="X",main="")
Output:

wide input matrix
the previous levelplot was based on data frame. so here we used a square matrix. it is different
format for understanding.
library("lattice")

a<- matrix(runif(100, 0, 5) , 10 , 10)
colnames(a) <- letters[c(1:10)]
rownames(a) <- paste( rep("r",10) , c(1:10) , sep=" ")
levelplot(a)
Output:

Flip and Reorder Axis
in R programming, t() function that allow to flip the coordinates and tranpose the input matrix.
we can change matrix order and heatmap is generate exactly as the input matrix.
library("lattice")
a<- matrix(runif(100, 0, 5) , 10 , 10)
colnames(a) <- letters[c(1:10)]
rownames(a) <- paste( rep("r",10) , c(1:10) , sep=" ")

levelplot( t(a[c(nrow(a):1),]),col.regions=heat.colors(80))
Output:-


