Heatmap with lattice and levelplot
This post explains how to use levelplot( ) function to build heatmaps.

This post explains how to use levelplot( ) function to build heatmaps.

Here, we can combine two data frame into one using cbind() and rbind() function.

here, we are shows dataset available in r environment and implementing multiple regression using r.

here,lm() and predict() function are used to implement linear regression in r

We are performing mean, median, trim operation using r environment.

here, we are creating one csv file and accessing element of csv file and plot the barchart.

We will learn sapply(), lapply() and tapply() in R.

A distribution of values that cluster around an average.

data frame is used for storing data tables.

you will learn to plot more than one curve on a single plot in R.

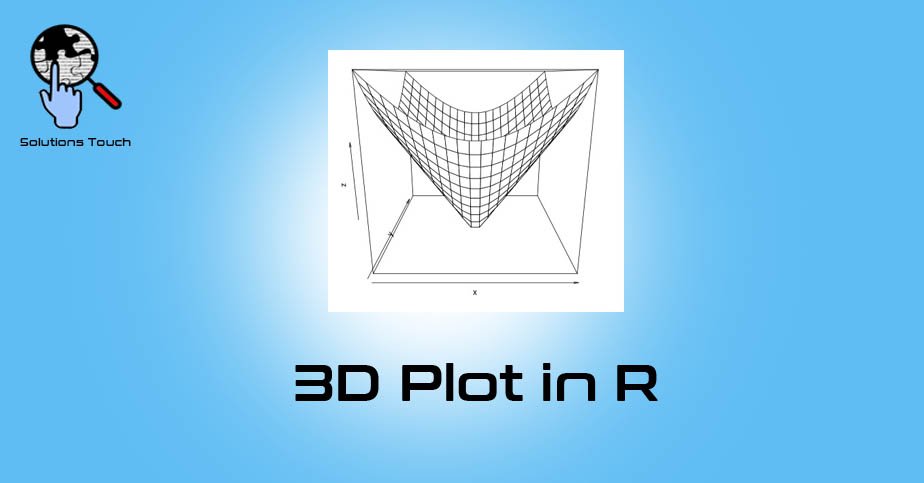
you will learn to create 3D plots.