1. Formulate question
Let's think how a data scientist would approach this problem well first a data scientist would carefully formulate the question that they're looking to answer why. Well, a clear and well-formulated question will determine the research and it will also affect the kind of data that you will go out and gather in fact.
2. Gathering and Clean data
gathering the data that will help us answer the question but real-world data is also messy. So we have to clean the data. We have to look out for missing data or incomplete data. We have to look out for errors and even bound formatting.
1. Remove missing data
2. Reduce incomplete data
3. Reduce inaccurate data
4. convert into good formate
3. Explore and visualize
We have to explore the data that we've gathered. And often this means visualizing the data so that we can better understand what it is that we're working with a graph or a chart is much more helpful than a table of numbers.
4. Train algorithm
our algorithm using our computer to identify patterns in the data. In our case, that algorithm will be our linear regression. And finally, we have to evaluate the results. How did our algorithm do? Did it answer our question of how accurate was our algorithm? In answering our question the process that I've outlined here is the process data scientists used to solve problems. This is their workflow for understanding and making sense of the world.
5. Evaluate
implementation
now we tring to implement the linear regression on the corona-virus-2019 dataset, firstly we download dataset on,
covid_19_data.csv
also we need a different module like pandas, matplotlib and sklearn
import pandas
from pandas import DataFrame
import matplotlib.pyplot as plt
from sklearn.linear_model import LinearRegression
then load covid_19_data.csv by using pandas function read_csv in object
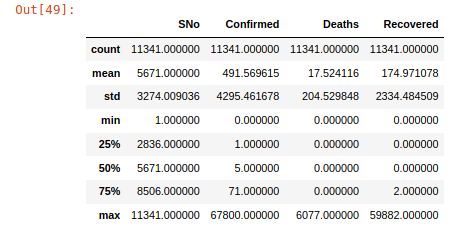
data = pandas.read_csv('covid_19_data.csv')now describe the dataset
data.describe()
Explore & Visualise the DataFrame
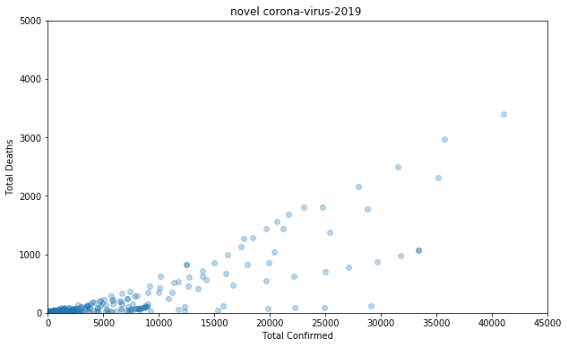
x = DataFrame(data, columns=['Confirmed'])
y = DataFrame(data, columns=['Deaths'])
plt.figure(figsize=(10,6))
plt.scatter(x, y, alpha=0.3)
plt.title('novel corona-virus-2019 ')
plt.xlabel('Total Confirmed')
plt.ylabel('Total Deaths')
plt.ylim(0, 5000)
plt.xlim(0, 45000)
plt.show()
Evaluate the Results
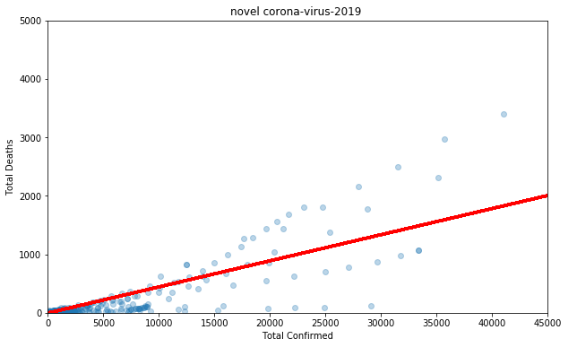
regression = LinearRegression()
regression.fit(x, y)
regression.coef_ regression.intercept_plt.figure(figsize=(10,6))
plt.scatter(x, y, alpha=0.3)
# Adding the regression line here:
plt.plot(X, regression.predict(X), color='red', linewidth=3)
plt.title('novel corona-virus-2019 ')
plt.xlabel('Total Confirmed')
plt.ylabel('Total Deaths')
plt.ylim(0, 5000)
plt.xlim(0, 45000)
plt.show()
regression.score(x, y)
